
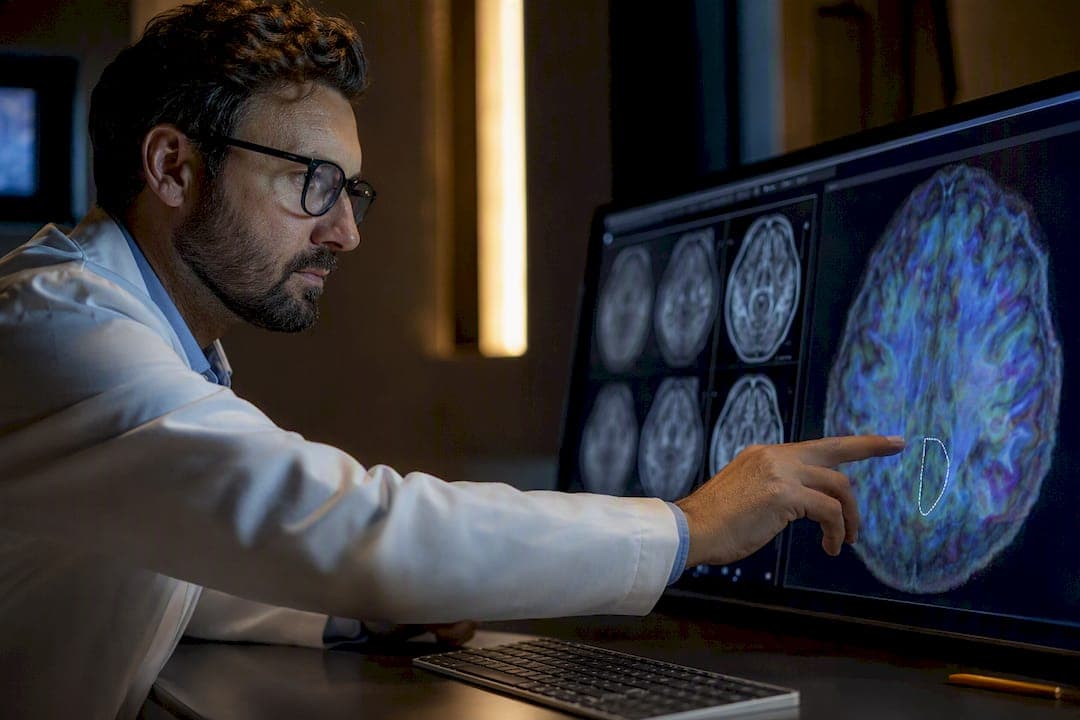
Quantitative imaging biomarkers are standardized, image-derived measurements, things like the Apparent Diffusion Coefficient, Standardized Uptake Value, and proton density fat fraction, that turn a scan into an objective, reproducible number. Clinicians and researchers use these metrics to stage disease, track how a tumor or organ responds to treatment, and anchor trial endpoints without relying solely on subjective visual reads or invasive biopsies.
TL;DR:
- Standardized acquisition protocols aligned with QIBA or IBSI improve the reproducibility and trustworthiness of quantitative imaging biomarkers.
- Validation through test retest, phantom, and multi-site studies ensures a biomarker's precision, accuracy, and bias meet clinical and research requirements.
- Reproducibility depends heavily on documenting every step, from imaging parameters to software versions, to enable reliable longitudinal and multi-site comparisons.
- Most clinical use cases, like tumor response or liver fibrosis, rely on validated biomarkers that have established thresholds for meaningful change.
- Multi-modality integration and synchronized data collection from lab, imaging, and clinical records are crucial for building decision-grade biomarker workflows.
What Are Quantitative Imaging Biomarkers, Exactly?
A quantitative imaging biomarker, often shortened to QIB, is an objectively measured characteristic extracted from a medical image that yields ratio scale or interval scale data rather than a subjective visual impression. That distinction matters more than it sounds. A radiologist's note that a lesion looks "smaller" is qualitative. An ADC value of 0.9 x 10^-3 mm²/s measured before treatment and 1.4 x 10^-3 mm²/s measured after is quantitative, and it carries units, a scale, and a measurable degree of uncertainty. The foundational review from the National Cancer Institute's Quantitative Imaging Network frames QIBs as tools for disease staging, therapy monitoring, and diagnostic accuracy precisely because they can be tracked over time and compared across patients and sites.
Not all QIBs are built the same way, and the difference shapes how much you should trust a given number.
Quantitative MRI (qMRI) parameters are biophysically grounded. ADC reflects water diffusion restriction in tissue. T1 and T2 relaxation times reflect specific physical properties of a voxel. These values have a known physical meaning independent of the software used to calculate them, which makes them relatively portable across scanners once acquisition is harmonized.
Radiomic features, by contrast, are software-dependent. A texture feature like gray level co-occurrence matrix entropy depends heavily on how an image was reconstructed, discretized, and segmented before the feature was extracted. Two labs running the "same" radiomics pipeline on the same scan can get meaningfully different numbers if their preprocessing steps diverge even slightly, a problem the Image Biomarker Standardization Initiative was built specifically to address.
Microscopy-based quantitative phase imaging (QPI) sits in a third category, generating label-free measures like cell dry mass and viscoelastic properties, mostly used today in preclinical and translational biomarker discovery rather than routine clinical practice.
Broadly, QIBs fall into these functional categories:
- Functional and metabolic: SUV from PET, perfusion fraction from DCE imaging
- Diffusion based: ADC and related diffusion tensor metrics
- Perfusion based: blood flow and blood volume parameters from dynamic contrast studies
- Volumetric: tumor volume, organ volume, hippocampal volume
- Texture and radiomics: IBSI-standardized shape, intensity, and texture features
- Microscopy-derived QPI: dry mass and mechanical property measures in cell-based assays
Understanding which category a biomarker belongs to tells you how skeptical to be about reproducibility before you ever run a repeatability study.
Which Imaging Modality Produces Which Biomarker?
Every modality generates its own family of quantitative imaging techniques, and knowing the map saves time when you're scoping a study or evaluating a vendor's claims.
CT delivers volumetric measurements (tumor burden, organ size), lung density metrics for emphysema quantification, and coronary artery calcium scoring for cardiovascular risk. It also enables opportunistic screening, where researchers extract bone density, visceral fat, or muscle mass from scans originally ordered for unrelated reasons, a growing area highlighted in imaging biomarker reference literature as one of the more efficient uses of existing imaging data.
MRI is the most biomarker-rich modality in routine use. ADC quantifies diffusion restriction, useful in oncology and stroke. PDFF quantifies hepatic fat content noninvasively. MR elastography measures tissue stiffness for liver fibrosis staging. DCE perfusion metrics characterize tumor vascularity, and hippocampal volumetry supports neurodegenerative disease research.
PET contributes SUV based metrics, most commonly SUVmax and SUVmean from FDG PET, used to assess tumor metabolic activity and treatment response. Amyloid PET quantification, expressed through standardized uptake value ratios, has become central to Alzheimer's disease research and, increasingly, clinical evaluation.
Ultrasound offers shear wave elastography for liver fibrosis staging, an accessible alternative to MR elastography in many practice settings, along with volume blood flow measurements used in vascular assessment.
Microscopy and QPI round out the picture for preclinical work: dry mass and viscoelastic metrics derived from label-free cell imaging are being applied in drug response assays and early diagnostic tissue assessments, with documented sensitivity and specificity in select research settings.
A quick reference:
- CT: volumetrics, lung density, coronary calcium, opportunistic bone/fat/muscle markers
- MRI: ADC, PDFF, elastography stiffness, DCE perfusion, hippocampal volume
- PET: FDG SUV metrics, amyloid PET SUVR
- Ultrasound: shear wave speed, volume blood flow
- Microscopy/QPI: dry mass, cell mechanical properties
If you're building a multi-modality trial protocol, this is also where integrated radiology planning earns its keep, matching the right modality to the right endpoint before data collection starts, not after.
How Do Standards Like QIBA and IBSI Make QIBs Trustworthy?
A biomarker is only as trustworthy as the standard behind it, and this is where two initiatives, the Quantitative Imaging Biomarkers Alliance (QIBA) and the Image Biomarker Standardization Initiative (IBSI), do the heavy lifting.
QIBA, run through RSNA, publishes Profiles that make specific, testable performance claims rather than vague promises of accuracy. A Profile for FDG PET SUV might specify a within-subject coefficient of variation of 10 to 12%, with a defined change threshold needed to call a response real rather than noise. These aren't abstract benchmarks. They're the numbers a trial statistician needs to power a study correctly.
IBSI took on a narrower but equally critical problem: radiomics feature definitions were inconsistent across software packages, making cross-study comparison nearly impossible. Through a multiphase, multi-institution validation effort, IBSI standardized 169 radiomic features and confirmed strong reproducibility across CT, PET, and MRI datasets, a result that meaningfully improved comparability between software implementations.
Pro Tip: Before adopting any radiomics software for a trial, ask the vendor whether their feature calculations have been benchmarked against the IBSI reference dataset. If they can't answer, treat every feature value with caution until you've run your own validation.
Standardization work like this doesn't happen in a vacuum. It depends on FAIR data principles, findable, accessible, interoperable, and reusable, being applied to imaging repositories so that biomarker catalogs can actually be reused for model building and cross-institution validation.
In practice, adopting these standards means:
- Selecting a QIBA Profile-aligned acquisition protocol whenever one exists for your biomarker
- Running phantom-based calibration at study startup and at defined intervals afterward
- Verifying analysis software against IBSI reference feature values before locking a pipeline
- Documenting every acquisition and reconstruction parameter so drift can be traced later
QIBA's own position is that measurement variability across devices, sites, and time remains the biggest obstacle to clinical translation, which is exactly why conformance to a published Profile carries more weight than an in-house validation study.
How Do You Measure Whether a QIB Is Fit for Clinical Use?
Precision, accuracy, and bias aren't abstract statistics concepts here. They're the difference between calling a real treatment response and calling measurement noise.
Precision describes how tightly repeated measurements cluster under unchanged conditions, typically expressed as within-subject coefficient of variation or intraclass correlation coefficient (ICC). Accuracy describes how close a measurement is to ground truth, usually established against a phantom with known properties. Linearity checks whether the biomarker responds proportionally across its expected range, and bias captures any systematic over or underestimation baked into the method itself.
A rigorous evaluation framework for QIB technical performance recommends specific study designs to establish these properties before a biomarker earns clinical or trial-grade status:
- Test retest studies: scan the same subject twice, close in time, to isolate measurement variability from true biological change
- Phantom studies: use a physical object with known, stable properties to isolate scanner and reconstruction effects from patient factors
- Multi-site cross validation: run the same protocol across different scanners and institutions to quantify site-to-site variability before pooling data in a multicenter trial
The practical payoff of this work shows up in how you interpret a single follow-up scan. If a QIBA Profile states that an ADC change above a specific threshold represents a true change at 95% confidence, then a measured change below that threshold in your patient likely reflects noise, not treatment effect, no matter how convincing it looks on the screen. The same logic applies to SUV: a change smaller than the established within-subject coefficient of variation threshold shouldn't be read as a metabolic response, even if the raw numbers moved in the expected direction.
This is also why measurement uncertainty has to travel with every reported value, not just the mean. Metrology principles applied to imaging make clear that longitudinal monitoring is meaningless without an accompanying estimate of precision, because an observed change with no confidence interval attached could just as easily be scanner drift.
A minimum reporting checklist for any QIB used in a study or clinical protocol should include:
- Acquisition parameters (scanner model, sequence, contrast timing)
- Reconstruction algorithm and settings
- Segmentation method (manual, semi-automated, or automated) and who performed it
- Preprocessing steps applied before feature extraction
- Software name and version number for every analysis step
Skip any one of these, and reproducing the result six months later, on a different scanner, becomes close to impossible.
Where Do QIBs Actually Change Clinical Decisions?
The theory only matters if it changes what a clinician does next, and in several disease areas, it already has.
Oncology is the most mature use case. Tumor volume change on serial CT or MRI feeds directly into response criteria used across trials. FDG PET SUV thresholds distinguish metabolic responders from non-responders earlier than anatomic size change alone, sometimes weeks before a tumor visibly shrinks. Radiomics-derived signatures are increasingly explored as prognostic signals and treatment-selection tools, though this remains an evolving evidence base rather than settled clinical practice.
Liver disease has arguably seen the fastest translation from research metric to clinical tool. PDFF, derived from MRI, quantifies hepatic fat noninvasively and has become a standard endpoint in nonalcoholic fatty liver disease trials, replacing repeat liver biopsies in many research protocols. MR elastography complements PDFF by grading fibrosis stiffness, giving clinicians a noninvasive way to monitor disease progression over years rather than relying on a single biopsy snapshot.
Neurology relies on volumetric and PET biomarkers to track Alzheimer's disease progression. Hippocampal volume loss and amyloid PET quantification are both used in research settings to enroll patients, stratify risk, and monitor experimental therapies, even as standardization of hippocampal volumetry across software platforms remains an active area of work.
Opportunistic screening is the newest frontier. Because CT scans ordered for unrelated reasons already contain bone density, visceral fat, and vascular calcification data, researchers are extracting cardiometabolic risk markers from routine scans at essentially no added cost to the patient. It's a low-effort way to surface risk that would otherwise go unmeasured.
A few threads run through all four areas. Every one of these applications depends on a biomarker that was validated for precision and bias before it was trusted for a decision. None of them work if the underlying acquisition protocol drifts unnoticed between the baseline scan and the follow-up. And in every case, the clinical value comes from tracking change over time, not from a single snapshot in isolation.
How Do You Build a QIB-Ready Workflow in a Trial or Clinic?
Getting from "we have a scanner" to "we have decision-grade data" is a sequencing problem more than a technology problem. Here's the order that works.
- Define the claim and endpoint before you scan anyone. Decide exactly what change threshold will count as a true response, using a QIBA Profile value where one exists rather than inventing your own cutoff.
- Choose QIBA and IBSI-aligned protocols wherever available. Don't reinvent acquisition parameters that have already been validated across multiple sites.
- Run phantom and calibration checks at site setup, then repeat them at defined intervals throughout the study, not just once at the start.
- Verify your analysis software against IBSI or an equivalent reference dataset before locking the pipeline, and document the software version you tested.
- Standardize segmentation and preprocessing steps, and log every parameter so a reviewer, or a future you, can trace exactly how a number was generated.
- Build data pipelines around FAIR principles, so imaging results can be linked back to pathology findings and outcome data rather than sitting in an isolated silo.
Pro Tip: Lock your analysis pipeline before you unblind any data. A practical approach used by experienced trialists is to pre-specify the claim, validate a Profile, run a pilot test retest across your actual scanners, set phantom-based acceptance criteria at each site, and only then let the analysis team see outcome data.
The step that trips up more programs than any other is the connection between imaging data and everything else the study collects. A biomarker that lives in a separate system from lab results, pathology reports, and outcome data is a biomarker nobody can efficiently analyze. Cross-discipline protocol alignment, matching lab draw timing, specimen handling, and imaging schedules, prevents this gap from forming in the first place, and it matters just as much for a two-site pilot as it does for a national multicenter trial.
What Kohealth Labs Brings to Imaging-Enabled Research
A QIB is only as useful as the data infrastructure around it. Trials and clinical programs that pair imaging biomarkers with lab results need those two data streams to arrive on the same timeline, in formats that don't require manual reconciliation before analysis can start.
Imaging-enabled research and clinical programs are supported by clinical laboratory testing, molecular and PCR testing, pathology support, specimen pickup, and LIS and EHR integration, the operational backbone that keeps a biomarker program from stalling on logistics. When lab data and imaging data are captured on a synchronized schedule and delivered through integrated systems, trial teams spend less time chasing missing values and more time on analysis. For clinics evaluating a lab partner specifically to support a biomarker-driven research effort, that operational fit often matters as much as any single test menu.
Data Sharing and Privacy in Quantitative Imaging Biomarker Research
Sharing imaging data across sites is what makes multi-site validation and IBS-style standardization possible in the first place, but it also raises real privacy obligations that can't be an afterthought.
DICOM files carry embedded metadata, patient identifiers, institution names, sometimes even burned-in text on the image itself, that has to be scrubbed before data leaves a site. De-identification has to happen consistently across every contributing institution, because a single site's inconsistent stripping process can reintroduce identifiable information into an otherwise anonymized dataset. For teams handling DICOM exchange directly, keeping the original, unaltered DICOM file intact during this process (rather than a compressed export) preserves the metadata fields that later need to be audited or corrected.
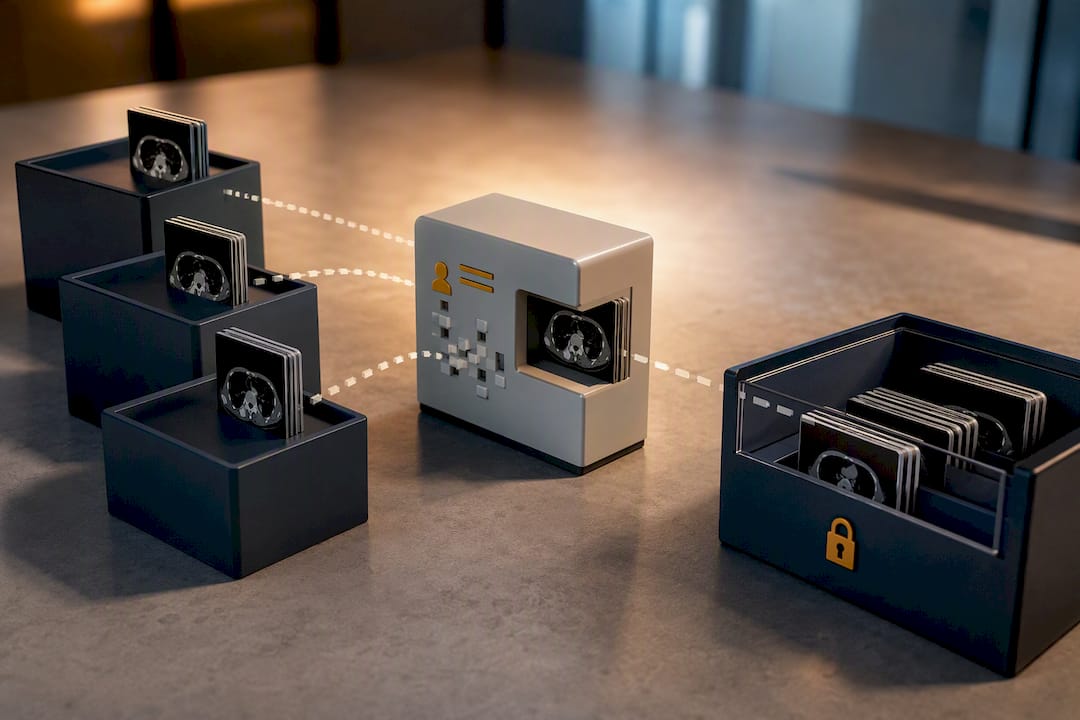
Under HIPAA, imaging data used in research typically requires either de-identification meeting the Safe Harbor or expert determination standard, or a data use agreement when limited datasets are shared between institutions. Multi-site trials add another layer: each site's institutional review board may impose its own data transfer and retention requirements, which means a data governance plan has to account for the most restrictive site in the consortium, not the average one.
FAIR data principles help here too, not just for reproducibility but for privacy by design. A well-structured, access-controlled repository with clear provenance tracking makes it far easier to demonstrate compliance during an audit than a loose collection of shared drives and email attachments. Programs working with rare disease cohorts or long-term registries face a heightened version of this challenge, since small sample sizes make re-identification risk higher even after standard de-identification steps, a concern worth building into study design from day one rather than retrofitting later.
What This Guide Gets Right That Most Overviews Miss
Most explainers on this topic treat standardization as a footnote. That's backwards. The single biggest determinant of whether a quantitative imaging biomarker will hold up in a real trial or clinical decision isn't the modality or the software, it's whether someone bothered to align the protocol to a QIBA Profile or an IBSI reference feature set before collecting a single scan.
The conventional advice tends to stop at "use ADC" or "use SUV" as if naming the metric were the hard part. It isn't. The hard part is knowing your scanner's within-subject CV, documenting your segmentation method, and resisting the temptation to call a small change "response" when it falls inside the noise band. Skip that discipline, and you've built a number that looks scientific but isn't decision-grade.
If there's one thing to prioritize first, it's this: define your claim and your acceptance threshold before you scan a single patient. Everything else, protocol selection, phantom calibration, software validation, follows from that one decision.
— Kohealth Labs
Where Kohealth Labs Fits Into Your Next Imaging Biomarker Program
Building a QIB program that survives peer review means the lab side of your data has to be just as disciplined as the imaging side. Clinical research organizations, pharmaceutical sponsors, and healthcare practices can rely on integrated laboratory diagnostics, including molecular and PCR testing, pathology support, specimen pickup, and LIS and EHR integration, so imaging data and lab data arrive on a schedule analysis teams can actually use.
If you're scoping a trial that pairs imaging biomarkers with lab endpoints, or if your practice needs a laboratory partner that can move fast on specimen logistics, start by reviewing available testing services for research and clinical programs. For teams that already know they need coordinated collection, you can schedule a specimen pickup directly and get logistics moving without waiting on a lengthy onboarding process.
Sources
For readers who want to go straight to the primary documents: the QIBA Profiles summary covers performance claims and conformance procedures. The IBSI standardization paper details the 169 standardized radiomic features. The foundational QIB review and the statistical methods review cover definitions and metrology in depth.
This article is general information, not a substitute for advice from a qualified doctor. Consult a qualified healthcare professional about your own circumstances before acting on anything here.
- Quantitative Imaging Biomarkers: The Application of Advanced Image Processing and Analysis to Clinical and Preclinical Decision Making
- The Image Biomarker Standardization Initiative: Standardized Quantitative Radiomics for High-Throughput Image-based Phenotyping
- QIBA summary (abridged) — Profiles and claims
- Radiopaedia
FAQ
What Are the Most Common Imaging-Based Cancer Biomarkers?
Tumor volume, FDG PET SUV metrics, and radiomics-derived texture features are the most widely used imaging biomarkers in oncology. ADC values from diffusion-weighted MRI are also common, particularly for assessing early treatment response before a tumor's size visibly changes.
How Much Does Biomarker Testing Cost?
Cost varies widely depending on the biomarker type, modality, and whether it's a blood-based or imaging-based test, so there's no single industry-wide figure to quote. Current pricing for specific test panels through Kohealth Labs is available directly through its testing services page.
What Are the MRI Biomarkers Used in Alzheimer's Research?
Hippocampal volume, measured through structural MRI, is one of the most established imaging biomarkers for tracking Alzheimer's disease progression. Amyloid PET quantification, which measures standardized uptake value ratios, is frequently used alongside volumetric MRI in research and increasingly in clinical evaluation.
What Is Quantitative Imaging?
Quantitative imaging is the practice of extracting objective, numeric measurements from medical images rather than relying on subjective visual interpretation alone. It underpins every quantitative imaging biomarker, from ADC and SUV to PDFF, and depends on standardized acquisition and analysis to produce reproducible results.
How Do Researchers Know a QIB Is Reliable Enough to Use?
A QIB is considered reliable when it has documented precision, accuracy, and bias, established through test retest, phantom, and multi-site studies. Alignment with a QIBA Profile or IBSI-validated feature set adds further confidence because those standards specify measurable performance claims rather than general assumptions.